Concrete Scanning Case Histories and Examples
Understanding Ground Penetrating Radar (GPR) in Concrete Scanning
Explore how GPR concrete scanning delivers results across various locations and conditions. Concrete scanning, a specialized application of ground penetrating radar, relies on precise geophysical instrumentation. While GPR equipment performs as designed by manufacturers, poor results often stem from inadequate survey design, minimal effort, or improper equipment selection. A key factor influencing all these issues is sampling—a critical element in both concrete scanning and broader geophysical surveys.
The question is: how much data is needed to achieve accurate results? For larger features, less data may suffice, but for detailed GPR concrete scanning, data collection must be thorough. Typically, this involves capturing 2–4 GPR readings per inch along the scan line, with lines spaced less than 3 to 4 inches apart. This approach offers high-resolution data, enhances post-processing, and delivers more reliable insights for your project.
The Importance of Perpendicular GPR Scan Lines
Collecting GPR scan lines in only one direction can lead to critical oversights, such as missing pipes, conduits, or reinforcing bars. Why does this happen? When scan lines are spaced too far apart, large gaps between the lines lack GPR data. As a result, narrow targets like pipes or conduits that fall between the scan lines may not appear in the GPR record.
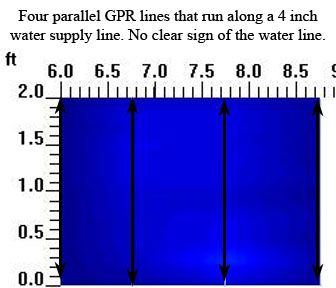
Take, for example, a buried 4-inch water line. In the first image, where GPR scan lines were collected parallel to the water line, the pipe went undetected. The blue diagram lacks any indication of the water line because the four parallel scan lines failed to intersect it.
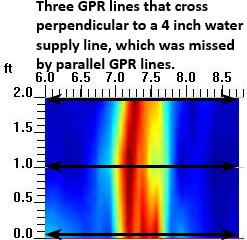
Now, compare this to the second image, where three perpendicular scan lines were collected across the water line. The bright red vertical response clearly reveals the presence of the pipe. This case demonstrates why collecting GPR scan lines in perpendicular directions is essential for more accurate results. Attempting to save money by scanning in only one direction often leads to incomplete data and costly mistakes
Why? Because if the scan lines are spaced too far apart then there are large areas between the lines that are missing GPR information. Thus, a conduit or pipe, which is offset to one side of a GPR scan line, may not appear in the GPR record. For example, a buried 4 inch water line is long but narrow enough target to not be detected. The first diagram, all blue without the bright red zone indicating the water pipe, demonstrates that the four GPR lines that are running parallel to the four inch water line did not reveal the presence of the water line.
Follow these leads…..
I have never let my schooling interfere with my education. Mark Twain
Why 2D Profile Lines or Cross-Sections May Be Insufficient
Relying solely on 2D profile lines or cross-sections can lead to incomplete and ambiguous results. Without a 3D representation, interpreting GPR data becomes significantly more challenging. While collecting GPR data in one direction can technically generate 3D images, the limitations of single-direction scans, as previously discussed, can still result in missed or unclear targets.
A single set of parallel lines often fails to provide the full picture, making it difficult to confidently identify features or targets of concern. For example, the 2D cross-section shown below illustrates a single concrete scan line. The upside-down horseshoe-shaped features, known as hyperbolas, are primarily caused by wire mesh. However, within this cluttered diagram, one or more hyperbolas may represent a buried line.
Which hyperbolas would you choose as the target? Without additional data or a 3D representation, this plot is difficult to interpret, even for experienced concrete scanners. This example highlights the limitations of 2D cross-sections and underscores the importance of comprehensive data collection for accurate results.

Concrete Scanning Large Areas Provides a More Complete Picture
Scanning larger areas with ground penetrating radar (GPR) often offers a more comprehensive understanding of what lies beneath the surface. The results below showcase a 75 by 20-foot concrete scan.
Shallow Penetration (Top Plot):
The top plot provides a plan view of shallow penetration, primarily mapping the reinforcing mesh. Variations in the color of the mesh indicate that it is uneven, suggesting it is not level across the scanned area.
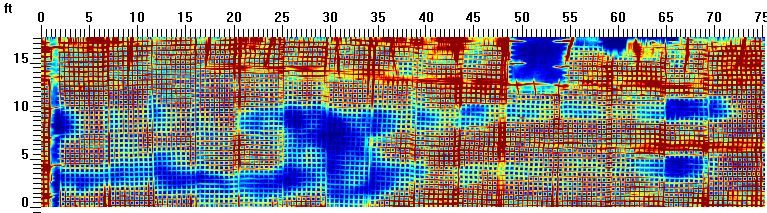
Deeper Penetration (Bottom Plot):
The second plot reveals what lies beneath the mesh. Underground facilities, likely power lines, are visible running horizontally (left to right) across the top of the plot. These facilities are located well below the mesh and are partially buried in the underlying soil.
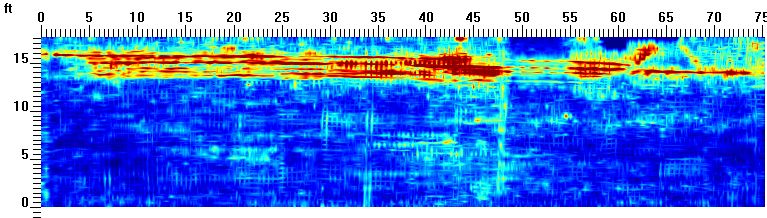
By scanning a larger area, GPR provides a clearer and more detailed picture of both shallow and deep features, helping to identify critical elements that may otherwise go unnoticed in smaller or limited scans.
Please note, as discussed in other areas of this site, the text, diagrams, and images are provided only as examples and for discussion purposes.

Review of Validation of NDT Equipment for Concrete
Review for GPR on the Validation of NDT Equipment for Concrete This document concluded Ground Penetrating Radar (GPR) : The ...