Concrete Scanner Training: Gaining Proficiency
Ground Penetrating Radar (GPR) is a powerful technology, but it is only as effective as the person operating it. To achieve mastery in concrete scanning, you must first build a strong foundation of knowledge. Reading and understanding the “Concrete Scanning with GPR” guide from Sensors & Software is the first and most critical step in any in-house training program. This guide is provided courtesy of Sensors & Software, Inc. and is available for download.
This document is more than a simple manual; it is a comprehensive playbook designed to elevate any concrete scanner’s skillset. It assists operators with the theoretical knowledge and practical insights to avoid costly mistakes, improve scanning accuracy, and deliver results for clients.
Here is an in-depth look at what the guide covers and how it shapes a successful operator.
A Deep Dive into the “Concrete Scanning with GPR” Guide
The guide is structured to build knowledge progressively, starting with the fundamentals and moving toward complex applications and data interpretation.
Basic GPR Theory
This foundational section demystifies the science behind GPR and concrete scanner training. It explains that a GPR system operates by transmitting radio waves into a material and detecting the reflections that bounce back from embedded objects. The strength and timing of these reflections allow operators to create an image of the subsurface.
Key concepts covered include:
• Penetration and Detectability: The guide details why GPR penetration varies. Factors like the concrete’s age, moisture content, and composition all play a role. It explains that wetter concrete has higher electrical conductivity, which weakens the GPR signal and reduces penetration depth.
• Reflection Strength: You will learn that the visibility of a target depends on the contrast in electrical properties between the target (like a metal rebar) and the host material (concrete). Metal produces a strong reflection, while non-metallic objects like PVC conduits are more subtle.
• Resolution: The guide clarifies the difference between detecting a single object and resolving two closely spaced objects. It provides context on how depth and target spacing affect the GPR’s ability to differentiate between multiple items.
• Depth Determination: More accurate depth measurement hinges on correctly calculating the GPR wave’s velocity through the concrete. The guide explains how to use the shape of a target’s hyperbola to calibrate this velocity for precise depth readings.
Applications for Concrete Scanning
This section sets realistic expectations by categorizing GPR applications based on their difficulty. This is crucial for project planning and client communication.
• Easy (Routine): Locating standard targets like rebar, post-tension cables, metallic conduits, and wire mesh are considered routine applications.
• Medium (Challenging): Tasks like detecting voids beneath a slab-on-grade or finding non-metallic glass rebar present more of a challenge. These require a better understanding of GPR responses and may involve adjusting scanner settings.
• Difficult: Identifying features like corrosion on rebar or finding cracks in concrete is very difficult. These applications require a highly trained eye, and the guide suggests looking for anomalies and comparing data across a larger area.
• Impossible: The guide clearly states that GPR cannot penetrate concrete mixed with steel fibers, as the fibers scatter the signal completely. It also confirms that GPR cannot provide an exact measurement of a pipe or rebar’s diameter.
GPR Best Practices
Theory is only effective when paired with proper procedure. This section outlines a professional workflow for GPR operators.
• Job Discussion: It stresses the importance of asking the right questions before arriving on-site. This includes the age of the concrete, the targets of interest, and the construction of the slab.
• Site Arrival: Operators are encouraged to perform a visual inspection of the site, looking for clues like electrical panels, drain covers, or visible conduits that might inform the scan.
• Preliminary and Grid Scans: The guide champions the use of grid scans over single-line scans whenever possible. A grid provides a much clearer, map-like view of the subsurface, minimizing the risk of missing off-angle targets.
• Data Analysis: It provides a systematic approach to reviewing data, urging operators to cycle through depth slices and cross-reference linear features on the plan map with their corresponding hyperbolas in the line data.
Software Tools for Analysis and Visualization
Raw data is only half the battle. This section introduces the software suite used to turn data into actionable insights.
• EKKO_Project and LineView: These tools are for viewing and analyzing individual scan lines. Operators can use them to measure depth, calibrate velocity, and adjust gain to make faint targets more visible.
• ConquestView: This software is used to review data collected in a grid, allowing operators to scroll through depth slices and see a plan view of the embedded targets.
• SliceView: A powerful feature within EKKO_Project, SliceView can stitch multiple smaller grids together to create a single, cohesive map of a large area.
• Voxler: For advanced presentations, the guide mentions Voxler, a third-party program that can import GPR data to create compelling 3D visualizations of the subsurface structure.
Case Studies
The guide includes over a dozen case studies that bring the theory to life. These real-world examples show how to interpret GPR data in various scenarios.
• Conduits under Rebar: A case study demonstrates how to find a deeper conduit that is partially masked by a shallower layer of rebar by looking for subtle hyperbolas in the data.
• Post-Tension Cables: Another example shows how to differentiate post-tension cables from rebar by mapping their characteristic draped profile, where they run shallower near columns and deeper in the middle of a slab.
• Radiant Heat Tubes: This study illustrates how to identify the curved patterns of radiant heat tubes, which helps distinguish them from the straight grid of rebar.
Tips and Tricks
This final section offers practical advice for overcoming common challenges in the field.
• Power Cable Detector (PCD): It provides instructions on using the PCD to identify live AC electrical conduits. The guide explains that the PCD measures the magnetic field from the current, which can supplement the GPR data. Please note that not all concrete scanners are equipped with PCD. Inquire before renting.
• Scanning Large Areas: It offers techniques for collecting data over large floors by scanning long individual lines and processing them later in the office.
• Filtering: The guide explains how and when to use a background subtraction filter to make very shallow targets easier to see.
Important Disclaimer: Theory vs. Experience
While the “Concrete Scanning with GPR” guide provides an essential theoretical framework, it is vital to understand that reading a manual does not make one an expert. GPR interpretation is a skill honed through hours of field practice and exposure to diverse site conditions.
The following procedures are designed to help operators adhere to good survey practices and standardize their workflow. However, they do not replace hands-on experience. Field conditions are rarely perfect, and an operator’s judgment—developed over time—is often the deciding factor in a successful scan. Treat these steps as a baseline for quality, but always rely on critical thinking and continuous learning in the field.
Performing a Concrete Scanning Survey
Section 1: Plan Your Survey
Proper planning is essential for accurate and efficient scanning. Follow concrete scanner training guidelines to set your project up for success:

- Choose Between a Line or Grid Survey
• Line Surveys: Best for smaller areas or when a quick overview is adequate. They are simpler and faster to set up.
• Grid Surveys: Recommended for more comprehensive scans. Grids provide greater detail and allow for more robust post-processing, especially when identifying anomalies that are parallel or diagonal to a scan line.
o Post-Processing Advantage: With a grid, software can better visualize and highlight features, making it easier to interpret anomalies.
o Coverage: Grids with both X and Y lines survey the area in two directions, reducing the risk of missed targets and giving a more complete subsurface picture. - Orient Lines Perpendicular to Known Targets
• When possible, align survey lines (or one set of grid lines) perpendicular to the expected direction of targets like conduits or pipes.
• Why: Crossing an anomaly with the scanner perpendicularly produces a clear hyperbolic response, making it easier to recognize in the data.
• Flat Line Response: Scanning directly on top of or parallel to an anomaly might only generate a flat line, which is much harder to identify—especially for less experienced users. - Break Larger Surveys into Smaller Grids
• For extensive areas, divide your project into smaller grids or sections.
• Benefits include:
o Lowering the risk of total data loss if one file becomes corrupted
o Simplifying management and ensuring your scan lines stay straight
o Simplifies post-processing by keeping data organized. - Determine Proper Line Spacing
• Ensure your line spacing is appropriate for the level of detail required.
o Too Wide: Increases the chance of missing important anomalies and decreases software interpretation reliability.
o Recommended Spacing: Always follow manufacturer guidelines, which account for antenna frequency and project specifics. - Decide Line Direction and Consistency
• Choose whether to start each line from the same edge or to alternate.
• Recommendation: Consistently Start from the same side whenever possible. This ensures a consistent axis for the processing software, resulting in more reliable and uniform results. - Account for Obstructions
• If there’s an obstruction in the grid (e.g., a column or equipment), place it in the upper right-hand corner of the X/Y grid.
• This way, the scanner runs into the obstruction and ends at it, simplifying navigation and data collection.
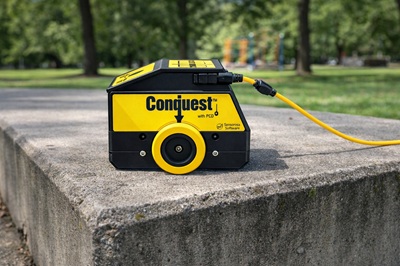
• The Conquest/TR1000 with the DVL500 has the advantage to collect a single line in two directions if there is an obstruction in the middle of a line.
Section 2: Conduct the Scan
Once your survey is planned, it’s time to set up and execute the scan. Follow these steps for accurate and efficient data collection:
- Set Up the Grid
• Mark the Grid: Use permanent marker, chalk, or tape to mark the grid directly on the surface. Clear visuals are crucial for keeping your scan organized.
• Use a Guide: For straight lines, consider using a pre-made piece of polycarbonate or linoleum flooring as a guide. This simple tool ensures consistent, straight lines and significantly reduces tracking errors during scanning.
• Double-Check Alignment: Verify that your grid is square and aligned with the project area. Even a small misalignment at the start can lead to skewed data and confusing results later. - Calibrate the Odometer
• Ensure the odometer is properly calibrated before starting the scan. An uncalibrated odometer leads to inaccurate positioning data, making it impossible to pinpoint targets accurately.
• Follow the manufacturer’s instructions to set the odometer calibration factor based on the specific surface texture and wheel type you are using. - Check Odometer Pressure and Run a Test Line
• Run a Test Line Without Saving: Before starting the actual scan, run a test line to ensure the odometer and scanner are functioning properly.
• Observe the DVL: Watch the Digital Video Logger (DVL) to confirm that the odometer is triggering the GPR to take readings consistently. Irregular triggering often points to wheel slip.
• Adjust Pressure: Adjust the odometer wheel or surface contact if necessary to maintain proper pressure and traction. - Fine-Tune Settings During the Test Line
• Adjust Gain: While running the test line, adjust the gain to enhance the visibility of anomalies. You want a clear contrast between your targets and the background noise.
• Experiment with Color: If the DVL allows it, experiment with the color scheme to make anomalies as easy to identify as possible while scanning. Different palettes work better for different eyes and lighting conditions.
• Familiarize Yourself: Use this opportunity to get comfortable with how the data appears on the DVL and ensure the settings are optimized for the specific project conditions. - Begin Scanning
• Position: Place the GPR system at the exact starting point of your grid or line.
• Pace: Move the system at a steady, consistent pace along the marked lines. Erratic speeds can sometimes affect data quality or operator fatigue.
• Monitor: Keep your eyes on the DVL for real-time data and adjust settings (e.g., gain, depth) as needed if conditions change. - Mark Key Locations
• Use flags, markers, or notes to identify anomalies or important features during the scan.
• This physical verification makes it much easier to locate and analyze these areas during post-processing, especially if you return to the data days later.
Best Practices for Test Lines
• Run Multiple Test Lines if Needed: If the first test line reveals issues with odometer pressure or settings, make adjustments and run another test line until everything is functioning properly. Don’t rush this step.
• Observe Anomalies in Real-Time: Use the test line to identify how anomalies appear on the DVL and ensure they are clearly visible.
• Don’t Save Test Data: Avoid saving test lines to keep your project files clean and organized.
Section 3: Analyze the Data
Proper data analysis is critical for interpreting your GPR survey results. Collecting the data is only half the job; understanding it is where the value lies. Follow these steps to ensure accurate and meaningful insights:
- Ensure Sufficient Data for Processing
• Make sure you’ve collected enough lines in your grid to allow for effective processing within the DVL or computer software.
• Tip: A denser grid with tighter line spacing will provide better resolution and detail, making it significantly easier to identify anomalies and structural elements. - Process the Data
• Use the DVL or EKKO_Project GPR Software to process the raw data.
• Adjust the color scheme to enhance visibility and highlight key features. Sometimes switching from grayscale to a high-contrast color palette reveals subtle details.
• Pay close attention to the depth of each slice in the SliceView to analyze subsurface features layer by layer. Don’t just look at the composite view; scroll through the depths. - Keep an Unprocessed Copy of the Data
• Always save an unprocessed copy of the raw GPR files before making any changes.
• Why? If a processed file becomes corrupted or if you need to reprocess the data with different settings (like a different velocity or filter), having the original files ensures you don’t lose valuable information.
• Back up the unprocessed files to an external drive or cloud storage for added security immediately after the job. - Interpret the Results
• Identify structural elements such as rebar, conduits, voids, and other buried objects based on the patterns you learned in the training guide.
• Use the depth measurements and patterns to create a detailed map of the scanned area.
• If using EKKO_Project, take advantage of its advanced visualization tools to generate 2D and 3D views of the data, which can help clarify complex intersecting targets. - Generate Reports
• Create professional reports with annotated images, depth measurements, and clear findings.
• Include any flagged anomalies or areas of interest that require further investigation or caution during cutting and coring.
Best Practices for Data Analysis
• Experiment with Color Schemes: Different color schemes can reveal features that may not be visible in the default view.
• SliceView Depths: Carefully analyze each depth slice. A conduit might only be visible in a specific 2-inch depth range.
• Backup Your Data: Always keep multiple copies of your raw and processed files to avoid data loss.
By following this structured approach—combining deep theoretical knowledge with disciplined field procedures—you ensure that every scan is performed to a higher standard than rushed and uninformed concrete scanner surveys. Experience will teach you the nuances, but these concrete scanner training practices will help keep your data more reliable and your job sites safer.